Email Delivery Rate vs Deliverability: The Difference
The two terms get swapped because every sending platform puts a "delivered" number at the top of its campaign report, and it is nearly always in the high nineties. That number counts messages a receiving server accepted. It was never designed to tell you which folder they went to, and no sending platform can see that. So a report can look healthy on the day half of your Gmail audience found you in spam.
This guide gives the formulas, works one example through from send to inbox, and sets out which tool can measure which number. It does not quote industry benchmarks for inbox placement, because mailbox providers do not publish any.
What is email delivery rate?
Email delivery rate is the percentage of sent emails that the receiving mail servers accepted instead of bouncing. A message counts as delivered when the server answers the end of the message with a 250 reply, whatever folder the message is filed in afterwards.
Delivered     = Sent - Bounced
Delivery rate = Delivered / Sent x 100
Bounce rate   = Bounced / Sent x 100   (so delivery rate = 100% - bounce rate)
Three details change the number from one platform to the next, so check how yours counts before you compare reports:
- What "sent" means. Some platforms count every address on the list. Others leave out addresses they suppressed before sending, such as earlier hard bounces and unsubscribes, which makes the rate look better.
- How soft bounces are counted. A temporary
4xxfailure is retried. If the retry succeeds the message is delivered; if the platform gives up, it is a bounce. The difference between the two kinds is covered in soft bounce vs hard bounce. - Late bounces. A server can accept a message with
250and send a bounce message back minutes or hours later. Reports read on the day of the send can be slightly too high.
What is email deliverability?
Email deliverability is the likelihood that an accepted email is placed in the inbox instead of the spam folder. The usual way to put a number on deliverability is the inbox placement rate.
Inbox placement rate = Emails placed in the inbox / Emails delivered x 100Two cautions about that formula. First, vendors do not all use the same denominator: some divide by emails sent, and some count a seed message that never arrived as "missing" in a third bucket. Ask which one a tool uses before reading its percentage. Second, the inbox includes Gmail's tabs. A message in Promotions was placed in the inbox, as explained in our guide to the Gmail Promotions tab.
What is the difference between delivery rate and deliverability?
Delivery rate measures whether the receiving server accepted the email; deliverability measures where the accepted email was filed. Delivery is decided during the SMTP conversation and is visible to the sender. Placement is decided afterwards by the provider's filter and is not reported back.
| Delivery rate | Deliverability (inbox placement) | |
|---|---|---|
| Question answered | Did the server accept the email? | Did the accepted email reach the inbox? |
| Decided by | The receiving mail server, during the SMTP conversation | The provider's spam filter, after acceptance |
| Failure looks like | A bounce with a code such as 550 5.1.1 | Nothing. The email is in spam and no error is sent |
| Visible to the sender | Yes, in every sending platform report | No. It can only be sampled or inferred |
| Mostly driven by | List quality: whether the addresses exist | Authentication, sender reputation, complaints and engagement |
How do you calculate delivery rate and inbox placement rate?
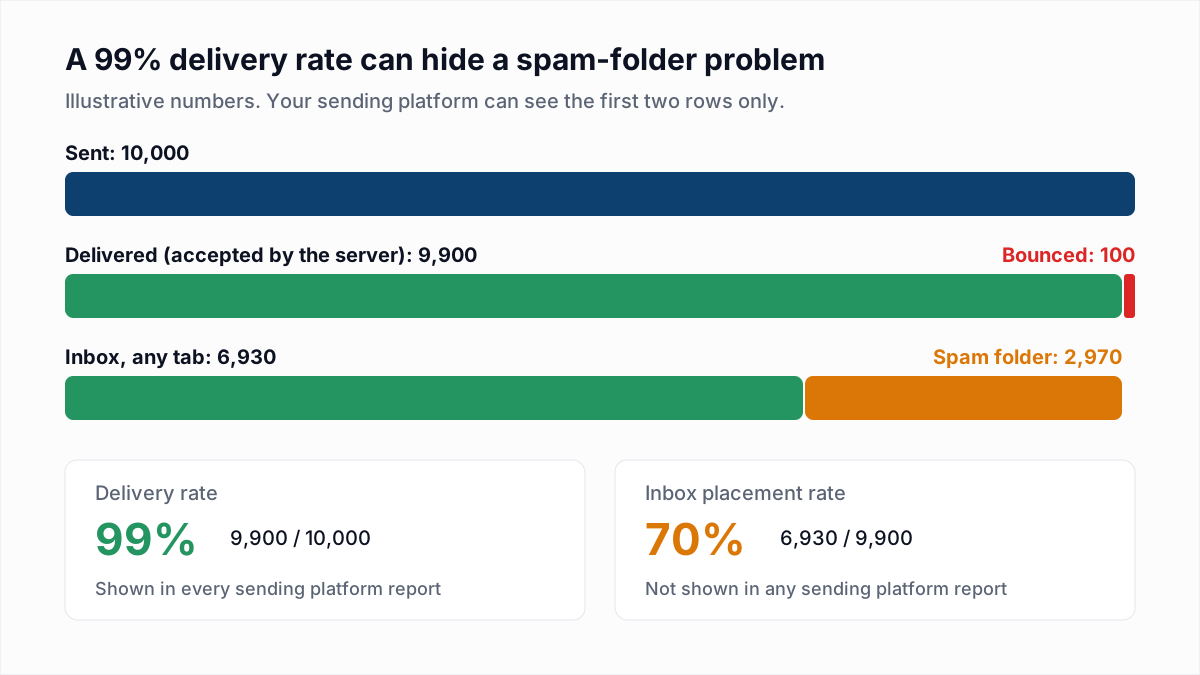
Calculate delivery rate by subtracting bounces from emails sent and dividing by emails sent; calculate inbox placement rate by dividing emails that reached the inbox by emails delivered. Here is one campaign worked through. The placement figures are illustrative, because in real life you would not have them.
- Sent. The campaign goes to 10,000 addresses.
- Bounced. 70 hard bounces and 30 soft bounces that never succeeded on retry: 100 bounced.
- Delivered. 10,000 - 100 = 9,900.
- Delivery rate. 9,900 / 10,000 x 100 = 99%. Bounce rate is the other 1%.
- Placement. Suppose 6,930 of the 9,900 were filed in the inbox and 2,970 in spam.
- Inbox placement rate. 6,930 / 9,900 x 100 = 70%.
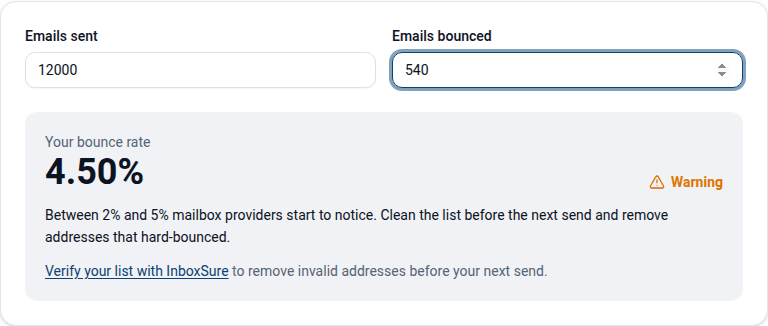
To check the first half with your own figures, enter sent and bounced counts into the free bounce rate calculator and subtract the result from 100.
Why can a 99% delivery rate hide a spam-folder problem?
A 99% delivery rate can hide a spam-folder problem because a message filed in spam was still accepted with a 250 reply, so the sending platform counts it as delivered. The spam folder produces no bounce and no error.
In the example, 2,970 people never saw the email and the report still said 99%. The symptoms show up elsewhere: clicks and replies fall on the same audience, sales from email drop, or a colleague with a Gmail address tells you where they found the message. Open rates are a weak signal here, because Apple Mail preloads images whether or not anyone reads the email; see Apple Mail Privacy Protection and open rates.
The reverse case exists too. A low delivery rate with good placement happens when an old list is mailed from a healthy domain: many addresses bounce, and the rest land in the inbox, for now. Bounces feed back into reputation, so that state does not last.
How can you measure delivery rate and inbox placement?
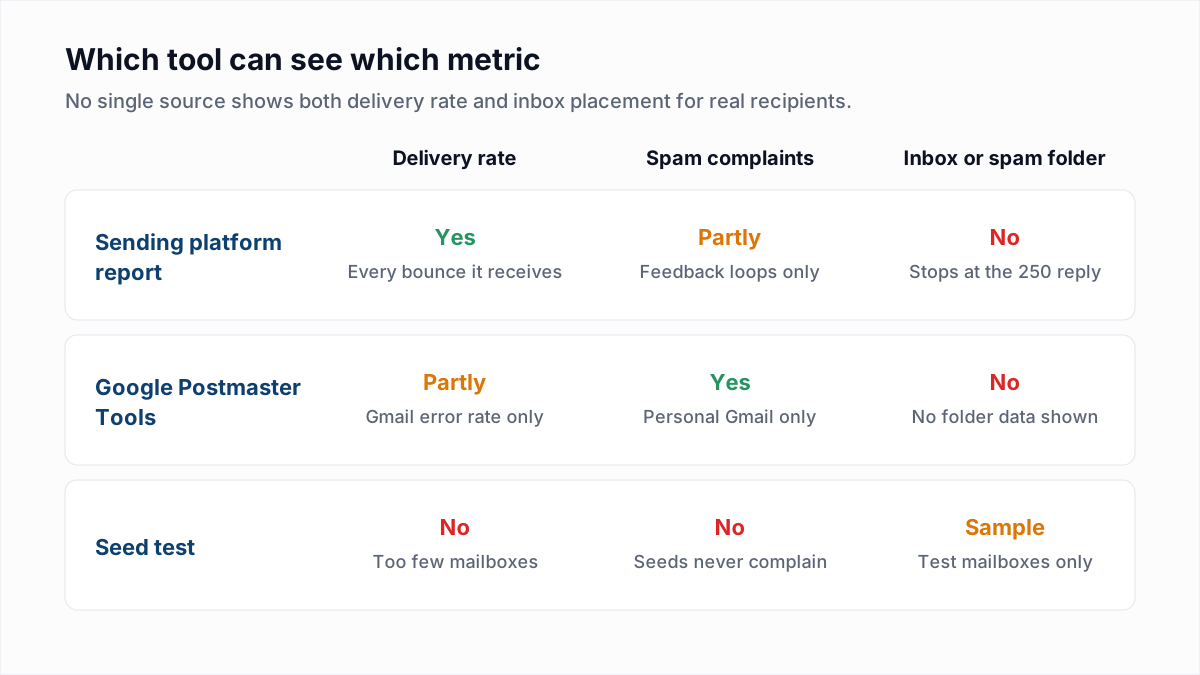
Delivery rate is measured exactly by your sending platform; inbox placement cannot be measured exactly by anyone outside the mailbox provider, and is estimated from Google Postmaster Tools, seed tests and engagement trends.
Sending platform reports
Your ESP logs the server's reply to every message, so sent, bounced and delivered are exact. Its complaint figure is partial: it only includes complaints that providers pass back through feedback loops, and Gmail does not pass individual complaints back. It knows nothing about folders.
Google Postmaster Tools
Google's Postmaster Tools dashboards help describes a spam rate dashboard showing "the percent of your messages that recipients manually mark as spam in Gmail" and a delivery errors dashboard showing the percent of authenticated messages "that were rejected or that temporarily failed". The same page says the data applies only to messages sent to personal Gmail accounts.
Neither dashboard is an inbox placement rate. Google notes that the spam rate dashboard reflects user-reported spam, not messages Gmail filed in spam automatically, so a domain with most of its mail in the spam folder can show a low spam rate: few messages reach an inbox to be reported. Setup and each dashboard are covered in how to use Google Postmaster Tools.
Seed tests
A seed test sends the campaign to test mailboxes at several providers and records the folder each copy landed in. A seed test is the only method that looks inside a mailbox, and its percentage describes the seeds, not your subscribers. Seed accounts have no history of opening or replying to you, filtering varies per recipient, and business domains behind security gateways are thinly covered. The limits are set out in full in how to test email deliverability before you send. Providers do not publish how closely seed results track real placement.
Which email metric is which?
The table below lists each delivery and deliverability metric with its formula, where to find it and what moves it.
| Metric | Formula | Where to find it | What moves it |
|---|---|---|---|
| Delivery rate | (Sent - Bounced) / Sent x 100 | Sending platform campaign report | List quality; blocks on your sending IP or domain |
| Bounce rate | Bounced / Sent x 100 | Sending platform campaign report | Invalid, abandoned and mistyped addresses; full mailboxes; blocks |
| Inbox placement rate | In inbox / Delivered x 100 | Seed test, as a sample only. Not in any provider report | Authentication, reputation, complaints, engagement |
| Gmail spam rate | Reported as spam by Gmail users / Delivered to the inbox of engaged Gmail recipients x 100 | Google Postmaster Tools, personal Gmail only | Who you mail, how often, and how easy it is to unsubscribe |
| Complaint rate (platform) | Complaints received through feedback loops / Delivered x 100 | Sending platform report; excludes Gmail | The same things as Gmail spam rate |
| Gmail delivery error rate | Rejected or temporarily failed / Authenticated messages sent to Gmail x 100 | Google Postmaster Tools, delivery errors dashboard | Sending volume spikes, reputation, authentication failures |
The two complaint figures rarely match, for reasons explained in spam complaint rate explained.
What is a good email delivery rate?
Mailbox providers do not publish a target for email delivery rate, so there is no official answer. Google's email sender guidelines, as of November 2026, set a spam rate limit and no bounce or delivery figure.
The working rule used by sending platforms is stated the other way round, as a bounce rate: well under 2% is healthy and 2% to 5% is a warning. That translates to a delivery rate above 98%. Treat it as a rule of thumb, not a provider limit; the bands and their sources are in how to reduce your email bounce rate. There is no equivalent rule for inbox placement rate that we can cite, so we do not give one.
How do you improve delivery rate and deliverability?
Improve delivery rate by removing addresses that will bounce before you send; improve deliverability by fixing authentication, complaints and sending behaviour. The two need different work, and the first is much the simpler.
| If you see | The problem is | Do this |
|---|---|---|
| Delivery rate below 98%, bounces say the mailbox does not exist | List quality | Verify the list and remove undeliverable addresses before the next send |
| Delivery rate falls suddenly, bounces mention policy, reputation or a block list | A block on your IP or domain, not the addresses | Keep the addresses; read the code in email bounce codes and fix the cause |
| Delivery rate is high, clicks and replies have dropped | Probably placement | Check SPF, DKIM and DMARC, then Postmaster Tools spam rate, then run a seed test |
| Delivery rate is high, Gmail spam rate is near 0.3% | Complaints | Mail less often, to more recent subscribers, with one-click unsubscribe |
The two metrics are linked in one direction. Bounces are one of the signals providers use to judge a sender, so a poor delivery rate today tends to become a placement problem later. A good delivery rate does not earn good placement by itself. If your mail is already in spam, start with why emails go to spam.
Where does email verification fit?
Email verification raises delivery rate by removing addresses that would bounce, and it does not measure or guarantee inbox placement. InboxSure is an email verifier, so that is the part it does.
InboxSure checks syntax, DNS and MX records, and asks the mail server whether the mailbox exists without sending a message. Each address comes back as Deliverable, Risky, Undeliverable or Unknown. Removing the Undeliverable group before a send takes those bounces out of the calculation above. Two limits are worth stating plainly: InboxSure does not run seed tests or report inbox placement, and consumer Yahoo, AOL, Outlook.com and Hotmail addresses usually come back Unknown today because those providers refuse the check before the mailbox is named.
If the number you need to move is delivery rate, upload the list to the bulk email verifier. The Free plan takes lists of up to 50 addresses with no card, and Pro is a flat $49 a month for lists of up to 10,000 addresses each. If the number you need to move is inbox placement, work through authentication and complaints first; a verifier will not fix those.
Frequently asked questions
Related reading
Ready to clean your email list?
Upload a CSV or XLSX and get every address marked deliverable, risky, undeliverable or unknown, with the reason. Free for lists of up to 50, no card. Nothing is sent to your contacts.